Lexington Informatics Tournament - web/scrainbow
This is the write-up that me and my team submited for the write-ups contest.
Before the write-up, I would like to thank the organizers of the Lexington Informatics Tournament for hosting the CTF. It was a great experience and I had a lot of fun solving the challenges. I would also like to thank the authors of the challenges for creating them. They were very fun and interesting to solve. I hope to participate in the next edition of the CTF.
Challenge Description:
Oh no! someone dropped my perfect gradient and it shattered into 10000 pieces! I can't figure out how to put it back together anymore, it never looks quite right. Can you help me fix it? URL: http://litctf.org:31780/

Author: halp
Apon visiting the URL, we are greeted with a webpage that displays a gradient that is made up of 10000 different colors. The gradient is displayed in a 100x100 grid, with each cell representing a different color. The goal of the challenge is to figure out how to put the gradient back together in the correct order.
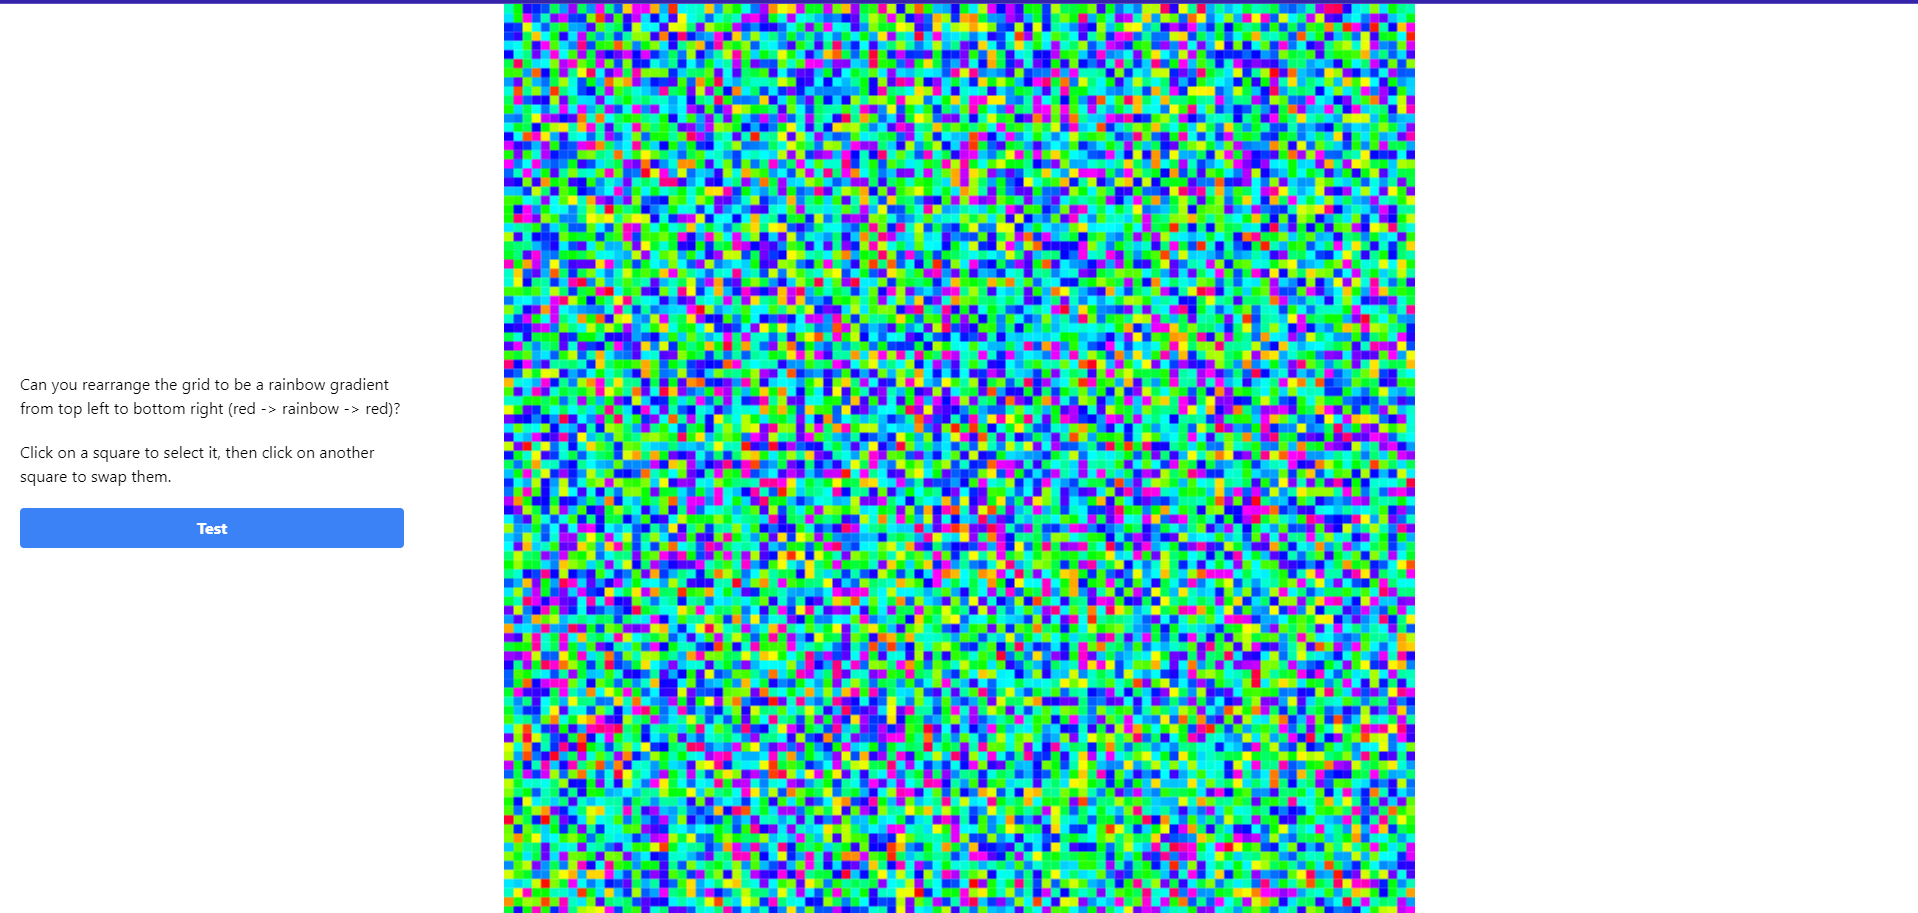
We were instructed to reassemble the gradient according to the guidelines provided in the text on the website.
Can you rearrange the grid to be a rainbow gradient from top left to bottom right (red -> rainbow -> red)?
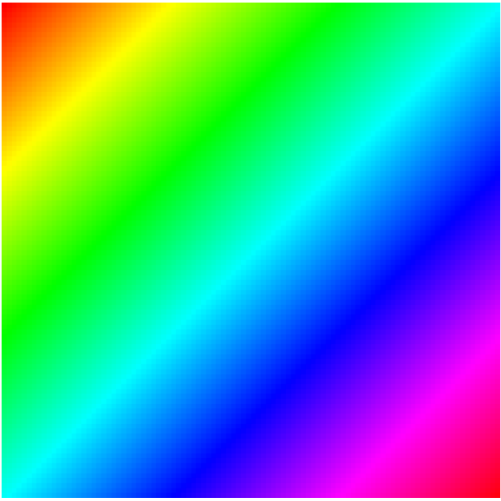
For reference, the grid shoud look something like this:
We could swap the colors by clicking on them, and each modification would be saved and sent to the server for verification when we click the “Test” button.
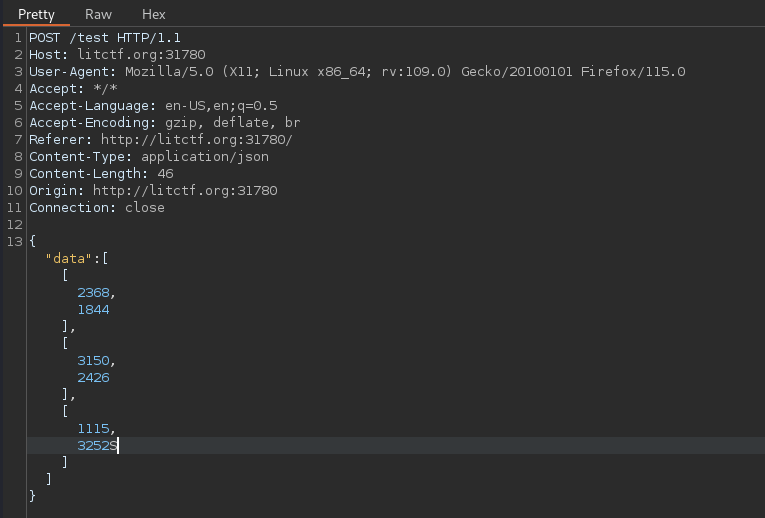
The data was sent to the server in json format, as we can see in burp:
Of course, swapping the colors manually would be very time consuming, so we decided to somehow automate the process.
Looking at the sorce code of the page, we can see that the colors array is stored on /data endpoint and the grid size is also specified on the /gridSize endpoint.
We save the colors array in a file called data.txt and we find out that the grid size is 100.
 <script async defer>
      (async () => {
        /** @type {string[]} */
        const data = await fetch("/data").then((r) => r.json()); //HERE IS DATA!!!

        const canvas = document.createElement("canvas");
        const ctx = canvas.getContext("2d");
        const resize = () => {
          const size = Math.min(window.innerWidth, window.innerHeight);
          canvas.width = size;
          canvas.height = size;
        };
        resize();
        canvas.style.cssText = `position: fixed; top: 50%; left: 50%; transform: translate(-50%, -50%);`;
        document.body.appendChild(canvas);

        const gridSize = await fetch("/gridSize").then((r) => r.json());//HERE IS GRID SIZE!!!

        const render = () => {
          const scale = canvas.width / gridSize;
          ctx.clearRect(0, 0, canvas.width, canvas.height);

          for (let i = 0; i < gridSize; i++) {
            for (let j = 0; j < gridSize; j++) {
              const x = i * scale;
              const y = j * scale;
              ctx.fillStyle = data[j * gridSize + i];
              ctx.fillRect(x, y, scale, scale);
            }
          }
          requestAnimationFrame(render);
        };

        requestAnimationFrame(render);

        let selected = -1;

        const moveHistory = [];

        const move = (i, j) => {
          if (selected === -1) {
            selected = j * gridSize + i;
          } else {
            const temp = data[selected];
            data[selected] = data[j * gridSize + i];
            data[j * gridSize + i] = temp;
            moveHistory.push([selected, j * gridSize + i]);

            selected = -1;
          }
        };

        canvas.addEventListener("click", (e) => {
          const scale = canvas.width / gridSize;
          const i = Math.floor(e.offsetX / scale);
          const j = Math.floor(e.offsetY / scale);
          move(i, j);
        });

        document.querySelector("#test").addEventListener("click", async () => {
          const res = await fetch("/test", {
            method: "POST",
            headers: {
              "Content-Type": "application/json",
            },
            body: JSON.stringify({
              data: moveHistory,
            }),
          })
            .then((r) => r.text())
            .then((r) => alert(r))
            .catch((e) => alert(e));
        });
      })();
    </script>
Seeing that the colors are stored in a json array, we can simply write a script that would sort the colors in the correct order and send the correct modifications to the server.
Solution:
import numpy as np
from scipy.spatial import KDTree
import json
import requests
from colorsys import rgb_to_hls
import numpy as np


def coords_to_index(x, y, size=100):
    return x * size + y


def hex_to_hsl(hex_color):
    hex_color = hex_color.lstrip('#')
    r, g, b = int(hex_color[0:2], 16), int(hex_color[2:4], 16), int(hex_color[4:6], 16)
    h, l, s = rgb_to_hls(r / 255.0, g / 255.0, b / 255.0)
    return h, l, s

# Load the color array from the file
with open('data.txt', 'r') as file:
    colors = eval(file.read())

sorted_colors = sorted(colors, key=lambda x: hex_to_hsl(x))
size = 100
diagonal_indices = []
for diag in range(2 * size - 1):
    for i in range(max(0, diag - size + 1), min(diag + 1, size)):
        diagonal_indices.append(coords_to_index(i, diag - i, size))

final_colors = [None] * len(colors)
for i, diag_index in enumerate(diagonal_indices):
    final_colors[diag_index] = sorted_colors[i]

modifications = []
current_colors = colors[:]


for i in range(len(colors)):
    if current_colors[i] != final_colors[i]:
        for j in range(i+1, len(colors)):
            if current_colors[j] == final_colors[i]:
                modifications.append([i, j])
                current_colors[i], current_colors[j] = current_colors[j], current_colors[i]
                break
print(modifications[:10])

open('modif.txt','w').write(str(modifications))


modification_dict = {"data": modifications}
modification_json = json.dumps(modification_dict, indent=4)
print(modification_json)

r = requests.post("http://litctf.org:31780/test", json=modification_dict)
print(r.text)
Explanation:
- Import Necessary Libraries:
import numpy as np
from scipy.spatial import KDTree
import json
import requests
from colorsys import rgb_to_hls
Libraries like numpy, json, and requests are imported. Notably, rgb_to_hls from colorsys is used to convert colors from RGB to HLS (Hue, Lightness, Saturation), which is essential for sorting colors by their “rainbow” appearance. KDTree is imported but not used in this script.
- Coordinate to Index Conversion Function:
def coords_to_index(x, y, size=100):
    return x * size + y
This function converts a 2D grid coordinate (x, y) into a single index for a 1D array, assuming the grid size is 100 x 100. This is crucial for mapping grid positions to a linear array.
- Hexadecimal to HLS Conversion Function:
def hex_to_hsl(hex_color):
    hex_color = hex_color.lstrip('#')
    r, g, b = int(hex_color[0:2], 16), int(hex_color[2:4], 16), int(hex_color[4:6], 16)
    h, l, s = rgb_to_hls(r / 255.0, g / 255.0, b / 255.0)
    return h, l, s
Converts a hexadecimal color (e.g., #FF0000) to its HLS components. This conversion allows for sorting colors based on their hue, lightness, and saturation, which is essential for creating the rainbow gradient.
- Load Color Data:
with open('data.txt', 'r') as file:
    colors = eval(file.read())
The script reads the color data from a file named data.txt. The eval function is used to convert the file’s content into a Python list of color hex codes.
- Sort Colors by HLS:
sorted_colors = sorted(colors, key=lambda x: hex_to_hsl(x))
The list of colors is sorted according to their HLS values. This sorting arranges the colors in a way that follows the rainbow gradient from red through the rainbow spectrum and back to red.
- Generate Diagonal Indices:
size = 100
diagonal_indices = []
for diag in range(2 * size - 1):
    for i in range(max(0, diag - size + 1), min(diag + 1, size)):
        diagonal_indices.append(coords_to_index(i, diag - i, size))
The script generates a list of indices that correspond to diagonal positions in a 100 x 100 grid. These indices are stored in diagonal_indices and represent the intended order for the sorted colors.
- Rearrange Colors According to Diagonal Order:
final_colors = [None] * len(colors)
for i, diag_index in enumerate(diagonal_indices):
    final_colors[diag_index] = sorted_colors[i]
The final_colors array is created by placing the sorted colors into the grid positions specified by diagonal_indices. This effectively arranges the colors in the desired rainbow gradient from top left to bottom right.
- Record the Necessary Modifications:
modifications = []
current_colors = colors[:]
for i in range(len(colors)):
    if current_colors[i] != final_colors[i]:
        for j in range(i+1, len(colors)):
            if current_colors[j] == final_colors[i]:
                modifications.append([i, j])
                current_colors[i], current_colors[j] = current_colors[j], current_colors[i]
                break
The script compares the original colors array to the final_colors array. It records the necessary swaps (modifications) needed to transform colors into final_colors. Each swap is saved in the modifications list.
- Output and Save Modifications (Optional):
print(modifications[:10])
open('modif.txt','w').write(str(modifications))
The first 10 modifications are printed for inspection. Then, the entire list of modifications is saved to a file named modif.txt.
- Send Modifications to Server:
modification_dict = {"data": modifications}
modification_json = json.dumps(modification_dict, indent=4)
print(modification_json)

r = requests.post("http://litctf.org:31780/test", json=modification_dict)
print(r.text)
The list of modifications is wrapped in a dictionary and converted to a JSON string. This JSON data is then sent to a server via an HTTP POST request. The server’s response is printed to the console.
Summary
The script sorts a list of colors to create a rainbow gradient in a 100x100 grid, records the steps needed to rearrange the colors from their original order, and sends these steps to a server. The key operations involve converting color representations, sorting by color properties, mapping grid positions, and communicating the results.
Proof of Flag
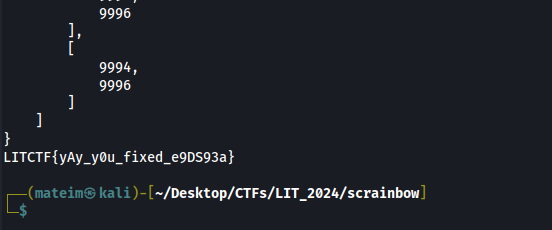
flag: LITCTF{yAy_y0u_fixed_e9DS93a}
Conclusion
This was a fun challenge that required a mix of color theory, grid manipulation, and web interaction. By understanding the rainbow gradient concept and leveraging Python’s capabilities, we were able to automate the process of reassembling the gradient. The script efficiently rearranged the colors and communicated with the server to complete the challenge. Overall, it was a rewarding experience that showcased the power of scripting and automation in solving complex tasks. (It also took me like 3 hours for some odd reason 😁 )